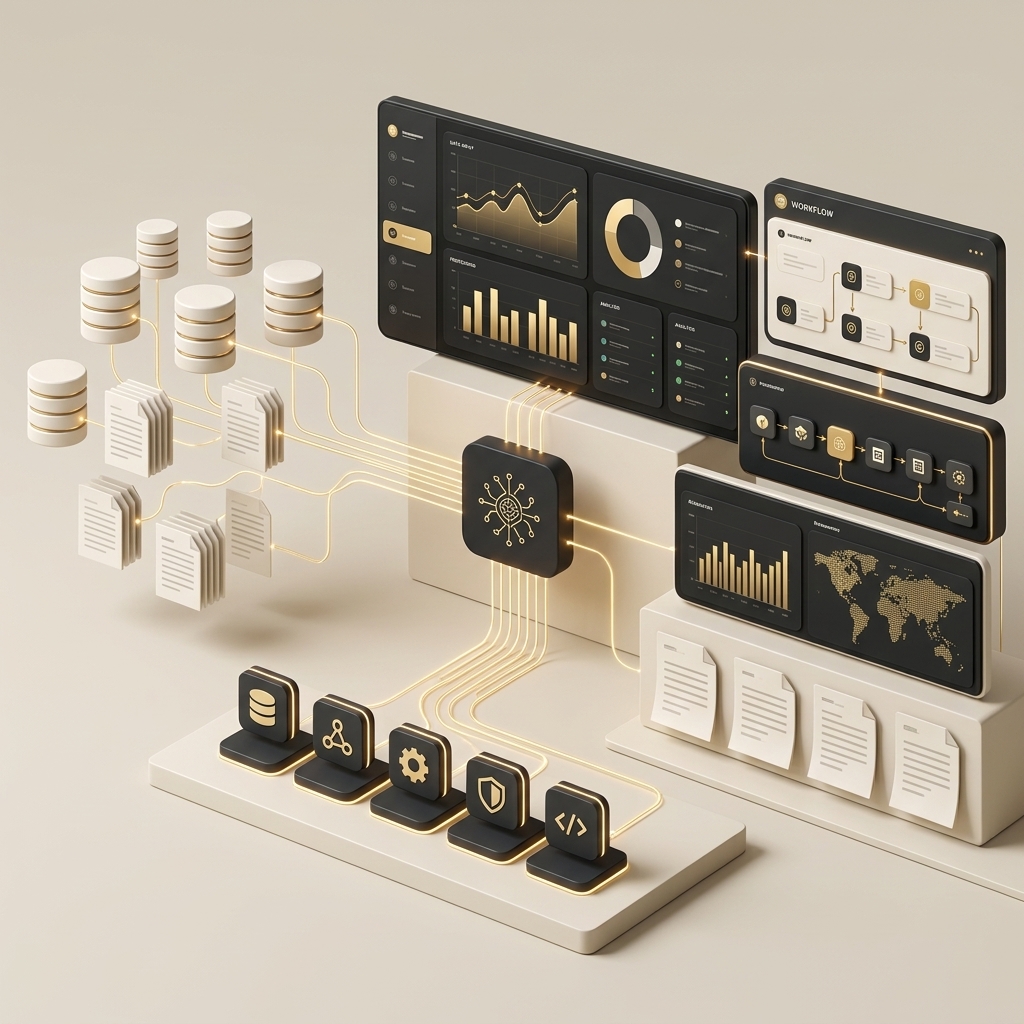

Reporting & Dashboards
Operational visibility without spreadsheet exports
Who Is This For?
Business owners, founders, and department heads who need real-time visibility...
The Problem
Leadership cannot see pipeline health, throughput, or KPIs without manual report assembly...
What You Get
Live dashboards tied to your production data—pipeline metrics, automation throughput...
Deliverables
- Live dashboards connected to production databases
- KPI tracking for pipeline, revenue, and throughput
- Automated report generation and delivery
- Role-based access for teams and leadership
- Mobile-responsive dashboard interfaces
Implementation Process
- 1 Define metrics that drive decisions
- 2 Model reporting data layers
- 3 Build responsive dashboard interfaces
- 4 Connect to live production databases
- 5 Iterate with stakeholder feedback
Industries Served
- Manufacturing
- Logistics
- Service Businesses
Data & Systems Integration
Ready to Unify Your Disconnected Data Sources into Live Dashboards?
Connect your PostgreSQL, Shopify, WhatsApp, and inventory APIs into one high-visibility command center with real-time operational metrics.
Direct engineering consultation • We respond within 1 business day